Two models that are asked a question, the kind used to rank order compounds and targets.
Two structure-free models that behave as comparison operators. One
model ranks two compounds against one kinase. The other ranks two kinases against one
compound, which is the selectivity question.
Both return an ordering with a prediction strength, and the reliability of that strength
was measured.
Reframing the question to massively increase effective training examples.
Prioritization in a screening campaign is a sequence of comparisons: which of these two
compounds to source or make next, which of these two kinases to counter-screen first.
Posing the task that way is a deliberate reformulation of the question the cascade
already asks, and it multiplies the data. A target measured against n ligands
supports n(n−1)/2 comparisons, and because position in the row
carries the question, each is presented in both orders, which cancels the halving:
n(n−1) rows from n measurements. One
kinase screened against 1,000 compounds becomes 999,000 training rows from 1,000
experiments. At corpus scale, an excerpt of 841,123 kinase inhibition measurements from the
Eidogen-Sertanty Kinase Knowledgebase could support 2.2 billion possible comparisons. The full argument is on the home page.
Model 1 · potency ranking
LigASeqLigB: which of two compounds is more potent at this kinase?
ligand A→ sequence →ligand B· 2,556 numbers in one row
Given two ligands and one protein sequence, it predicts which of the two ligands is
more potent against that sequence. It is used to rank order molecules against a
single target. No protein structure and no docked pose are used; the protein enters
only as a sequence embedding.
0.69accuracy on the ChEMBL test set as deployed, over 1,836,100 comparisons across 477 targets. Figures here are as reported, over 1,836,100 comparisons.
0.89accuracy on the pairs the model was fitted on
0.88accuracy when acting only on predictions at strength 0.70 or above, 15.3% of all comparisons, against 0.69 answering everything
0.03mean departure from exact reversal when the two ligands are swapped
The whole comparison is one row. The order is the question: ligand A first, the
sequence in the middle, ligand B last. Figure taken from the
LigASeqLigB report.
Where the potency model is accurate
Accuracy is not one number. It depends on how far apart the two compounds really are,
and on whether the model has seen either of them before. Both tables are the ChEMBL
test set, from the report, with accuracies shown as percentages.
By the true potency gap
Potency gap between the two ligands
Comparisons
Accuracy
under 0.5 log
517,017
0.57
0.5 to 1 log
430,894
0.66
1 to 2 logs
548,692
0.75
over 2 logs
339,497
0.84
all
1,836,100
0.69
By how new the compounds are
How many of the two ligands are new to KKB
Comparisons
Accuracy
neither
1,029,941
0.73
one
541,031
0.67
both
265,128
0.58
Chemistry the model has never seen on either side is the hardest case, and it is
also the case a screening run is made of. Read this table before quoting 0.69.
Acting only on confident predictions
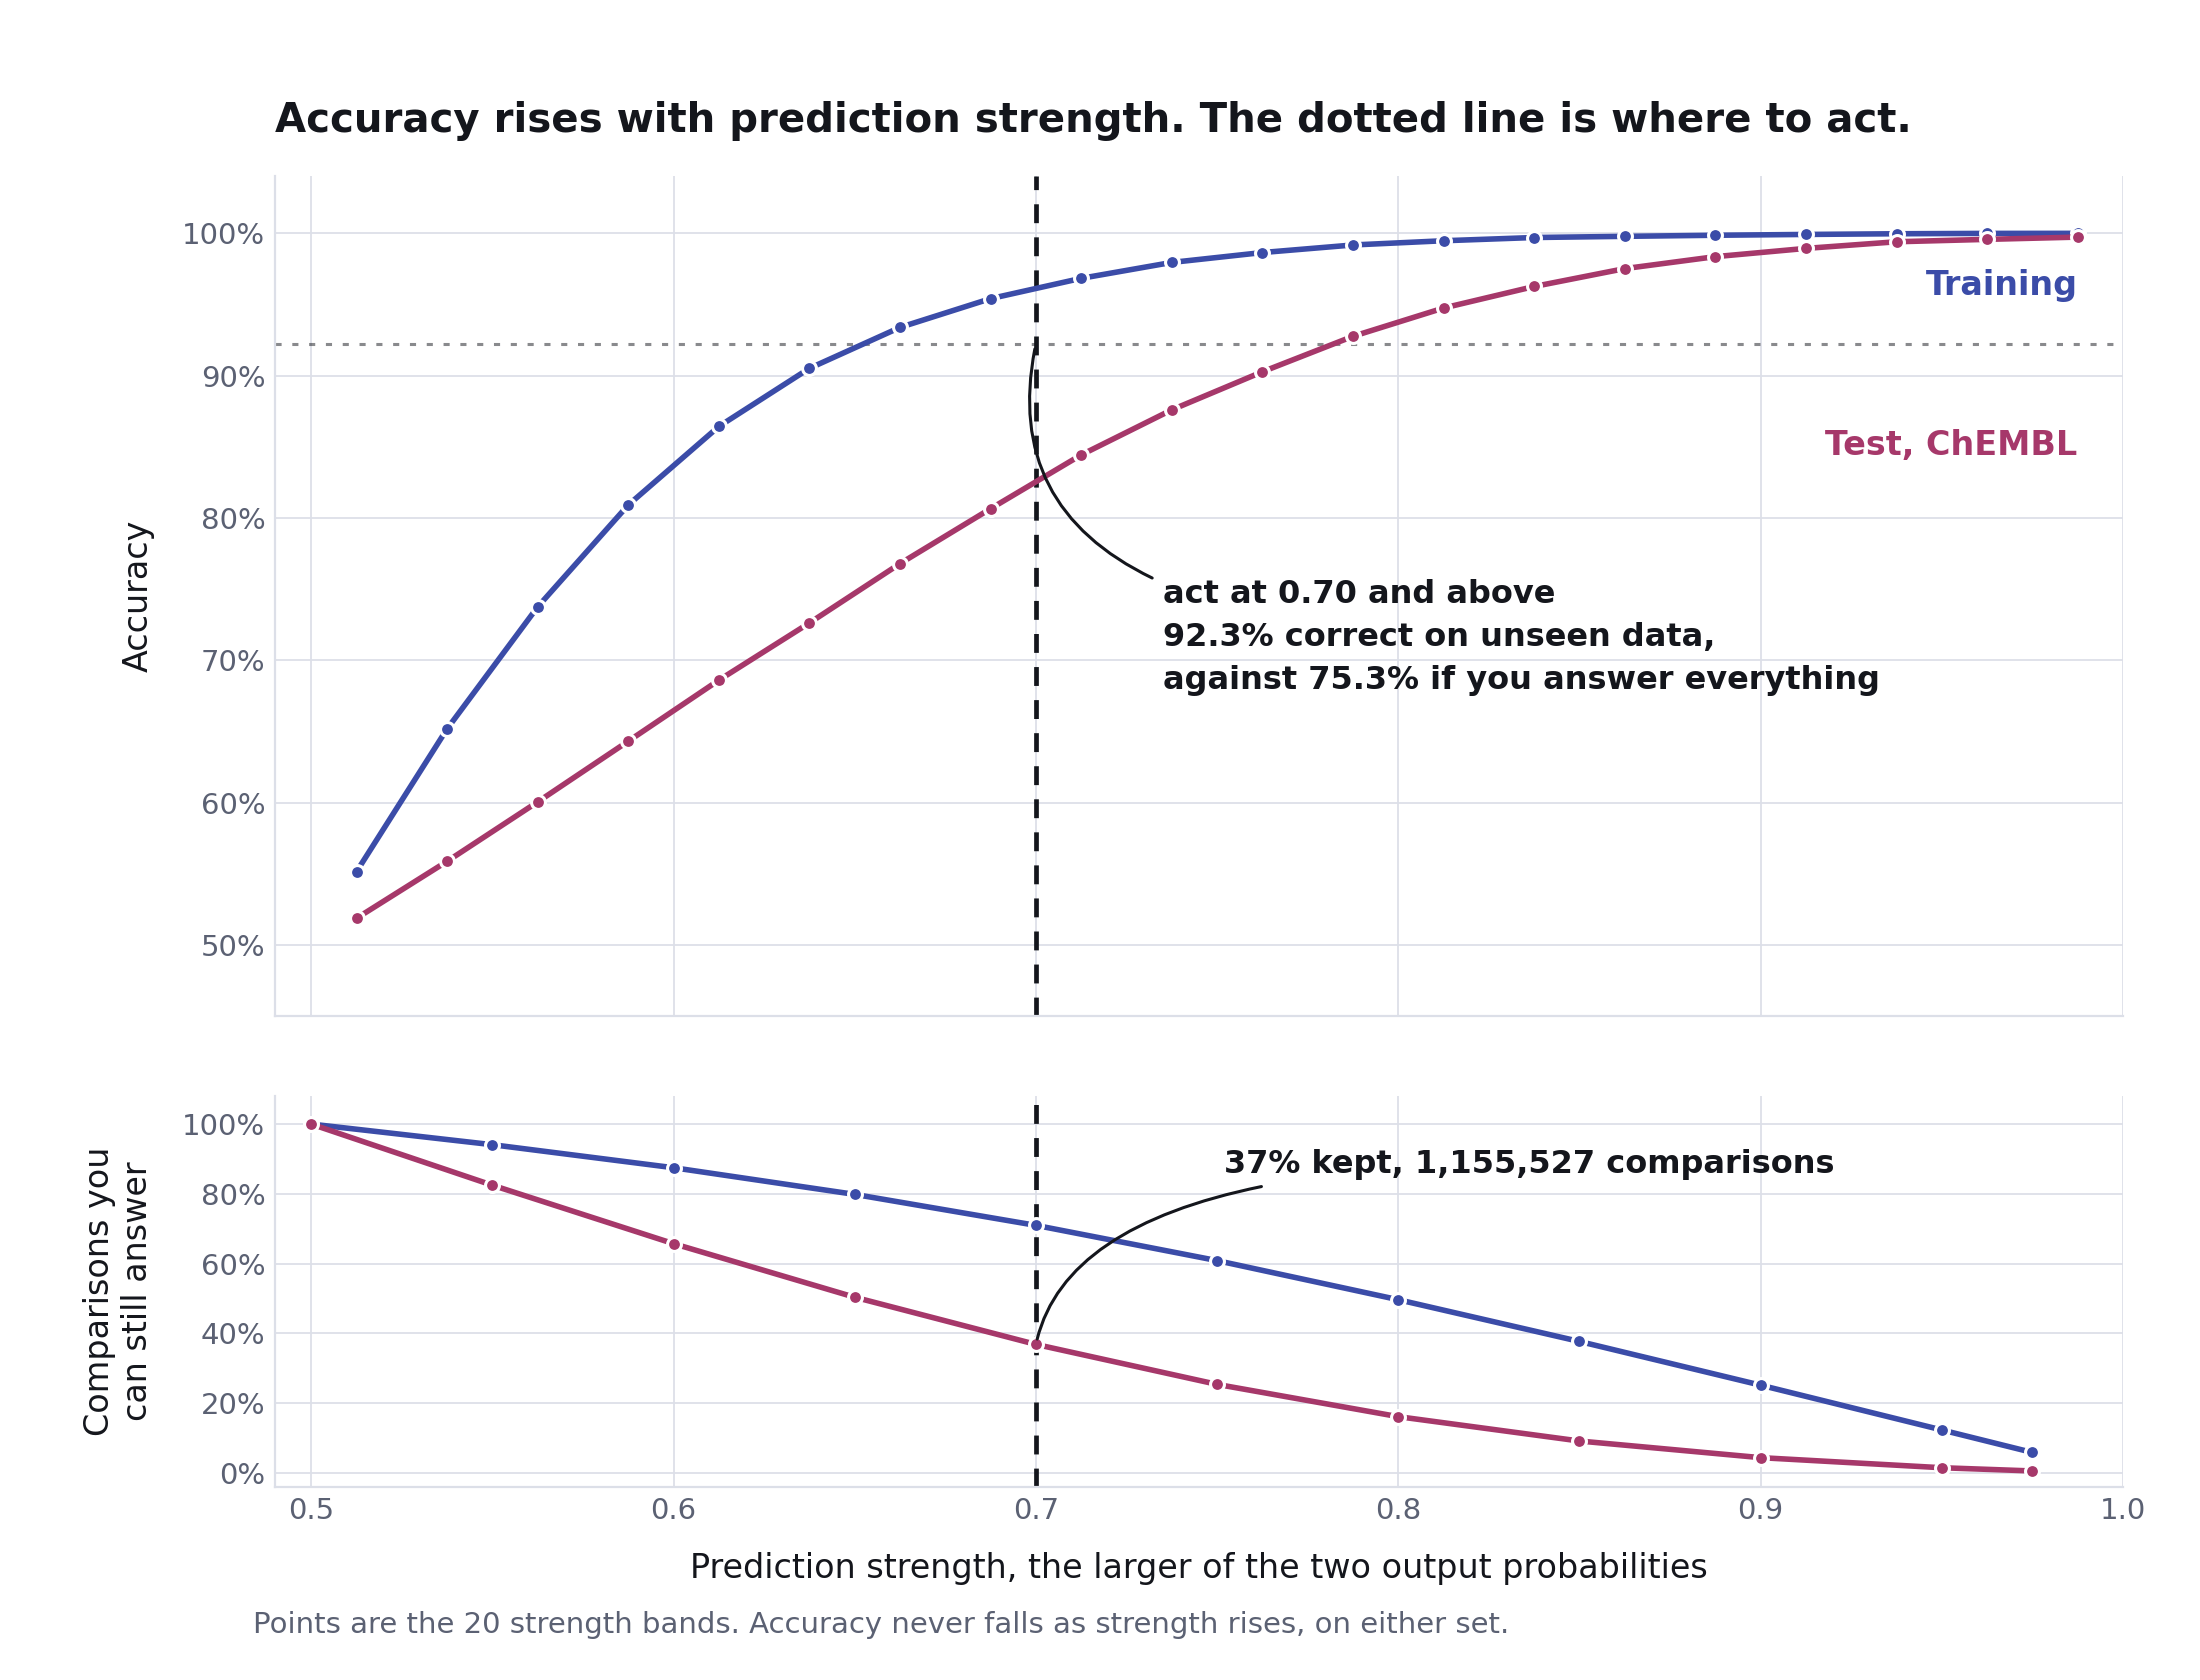
Prediction strength runs from 0.5, a coin flip, to 1.0. Raising the bar buys accuracy and costs coverage. The report names
0.70 as the useful operating point.
Act only at strength
Predictions kept (of 1,836,100)
Share
ChEMBL test accuracy
0.50, answer everything
1,836,100
100.0%
0.69
0.60
788,227
42.9%
0.81
0.70
281,583
15.3%
0.88
0.80
79,165
4.3%
0.90
Strength does not mean the same thing on the two sets.
On the training pairs a 0.7 prediction is right 0.98 of the time; on ChEMBL the same 0.7
is right 0.88 of the time. The ordering is reliable, the absolute number is not
transferable. Every figure in this table is the report's own, over the same
1,836,100-comparison ChEMBL draw as the headline 0.69.
Model 2 · selectivity
SeqALigSeqB: which of two proteins does this compound prefer?
sequence A→ ligand →sequence B· 1,998 numbers in one row
A random forest that takes two protein sequences and one ligand in a fixed order and
returns which protein binds the compound more potently. Trained on the KKB, tested on
ChEMBL measurements the model has never seen. The comparison is put inside the row, so
the model is trained on the selectivity question itself rather than on two separate
scores that would then have to be compared.
0.75test accuracy on 3,137,588 unseen ChEMBL comparisons
0.94training accuracy on 4,340,117 comparisons
0.92accuracy when acting only at prediction strength 0.70 and above, 1,155,527 comparisons, 36.8% of the set
95.1%of unseen comparisons change their declared winner when the two proteins are swapped
The two proteins occupy fixed positions and the position is the question. Figure taken
from the SeqALigSeqB report;
structures are ABL1 from PDB 2GQG, which has dasatinib bound, and GSK3B from PDB 1Q5K.
Where the selectivity model is accurate
By the size of the true potency difference
Separation
Test n
Test accuracy
Under 0.5 log
696,096
0.58
0.5 to 1 log
761,498
0.72
1 to 2 log
1,067,910
0.81
Over 2 log
612,084
0.90
Where the two proteins are within half a log of each other, 0.58 is close to a coin
flip. Two kinases a compound genuinely cannot tell apart are two kinases the model
cannot tell apart either.
By the model's own confidence
Prediction strength
Test n
Share
Test accuracy
0.5 to 0.6
1,075,800
34.3%
0.58
0.6 to 0.7
906,261
28.9%
0.74
0.7 to 0.8
650,028
20.7%
0.88
0.8 to 0.9
368,755
11.8%
0.96
0.9 to 1.0
136,744
4.4%
0.99
This is the practical result. Accuracy rises at every step and never falls, so the
model flags its own uncertain calls. Prediction strength is defined the same way as for the potency model, so the two can
be read side by side.
Choosing a cutoff
Act only at strength
Test kept
of set
Test accuracy
0.50, answer everything
3,137,588
100.0%
0.75
0.60
2,061,788
65.7%
0.84
0.70, the operating point
1,155,527
36.8%
0.92
0.80, a shortlist that should not contain mistakes
505,499
16.1%
0.97
0.90
136,744
4.4%
0.99
What raising the cutoff buys, and what it costs. Figure taken from the
SeqALigSeqB report.
0.70 is the operating point the report argues for.
Going from 0.50 to 0.70 buys 17 accuracy points and costs 63% of the answers; going on
from 0.70 to 0.90 buys only 7 more and costs 88% of what remained. Note that strength
does not mean the same thing on the two sets: on training comparisons a 0.70 prediction
is right 0.99 of the time, on ChEMBL the same 0.70 is right 0.92 of the time. The ordering
is reliable, the absolute number is not transferable, which is why the cutoff must be
set from the test column.
Limitations
Only the sequences each model was trained on were measured, 695 for potency, 728 for selectivity. Anything else is scored but unvalidated.
Both models ship the vectors for the sequences they were trained on, and a sequence
outside that set is encoded on request with the same ESM2 recipe rather than being
refused. So you can paste an arbitrary kinase, a resistance mutant for example, and get an answer. What you do not get is any claim to accuracy: every figure on this
page was measured between sequences the models were trained on. Pasted sequences are
flagged as unvalidated in the results.
Wild type against its own mutant is unmeasured for selectivity.
Every KKB comparison was used for training, including all 5,846 in which a wild type
is compared against one of its own mutants. Because nothing was withheld and ChEMBL is
keyed by gene and therefore contains no mutants, this release has no measured
wild-type-versus-mutant accuracy and none can be quoted for it. The model is trained
on those comparisons and will predict on them; that capability is unmeasured rather
than absent.
Close calls are close to chance on both models.
Under half a log of separation, the potency model scores 0.57 and the selectivity
model 0.58. Neither should be used to resolve a two-fold difference. Use the
confidence spread to decide what to act on, and read the cutoff tables above before
picking a threshold.
The same confidence number does not carry the same accuracy on the two models.
Both define prediction strength the same way, 0.5 to 1.0, so the scales line up. What they buy does not. A 0.70
is worth 0.88 accuracy on the potency model and 0.92 on the selectivity model, and
both figures are specific to that model's own test set. Read each tool's own band table
rather than carrying a threshold across.
Neither model estimates a potency.
Both answer a comparison with an ordering and a strength, not a pIC50. There is no number
here to put in a table as a predicted activity.
Research reports
LigASeqLigB potency: 1,024-bit Morgan baseline. Input layout, training and test construction, accuracy
by gap and by novelty, the strength/accuracy trade, the worked bosutinib example,
and how a model this size was trained in 15 pooled chunks.
SeqALigSeqB selectivity: input layout, the full worked ABL1/dasatinib/GSK3B case with both sequences,
data construction from bounded readings, accuracy by separation and by confidence,
order reversal, the five-band strength table, and the export bundle.
Both reports are copied here byte for byte from the model sandbox. They are under
third-party review; if a number changes there, it changes here, and this page is
updated from them rather than edited on its own.
![The potency model: ligand A, one kinase sequence and ligand B enter a single random forest in that fixed order. Each ligand becomes a 1,024-bit Morgan count fingerprint plus 14 descriptors; the sequence becomes 480 ESM2 numbers. The forest returns the probability that ligand A is the more potent of the two, shown on a confidence bar running from A is more potent to B is more potent. The worked case is bosutinib, measured pIC50 8.96, against a pyrazolo[3,4-d]pyrimidine at 4.50 on the ABL1 kinase domain, RCSB 3UE4.](/assets/v2/arch-ligaseqligb.png?v=20260812c)